
In the face of global LNG supply market madness, U.S. drillers are cleverly upping rig counts, their secret weapon against energy chaos. Imagine this: fewer rigs, yet a production powerhouse still emerges. Why? They’ve mastered the art of doing more with less, like a chef who makes a gourmet meal from leftovers. Despite fewer drills, the U.S. strikes production records, proving efficiency rules the day. Want the full scoop on this energy rollercoaster? Stay tuned!
Quick Overview
- U.S. drillers are adapting to global LNG supply volatility by increasing rig counts strategically.
- Technological advances and efficiency improvements help offset the need for more rigs despite market volatility.
- U.S. energy resilience is demonstrated with high production levels amid fluctuating global LNG markets.
- Infrastructure investments are crucial to handle capacity expansion and maintain operational balance.
- Environmental considerations remain critical as drilling activities increase to meet LNG demand.
What Drives U.S. Rig Counts?
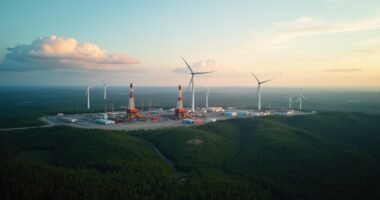
While market forces and exciting technological advances often tug at the strings of U.S. rig counts, the dance between drilling activity and commodity price fluctuations remains a pivotal performer on center stage. Declining prices in crude oil and natural gas orchestrate a startling choreography with rig reductions—33% for oil, 23% for gas, strutting their stuff from 2022 to 2025. Drilling intensity adjusts like a thermostat at price thresholds. Regional shifts, like North Dakota’s oil blossom and Pennsylvania’s gas surge, offer a moving canvas, drawing lines influenced by price signals. Despite this intricate ballet, output and rig counts curiously unfurl different tales. As crude oil production in the Lower 48 States reached a record of 11.4 million barrels per day in July 2025, it highlighted the industry’s capacity to enhance output even amidst fewer rigs. Efficiency improvements have become increasingly pronounced, particularly in the Permian Basin, where drilling and completion times have seen significant reductions. Supply chain operators are increasingly turning to AI-powered emissions tracking tools to measure and manage Scope 3 emissions generated across upstream and downstream drilling activities.
Exploring U.S. Rig Count Trends: Past to Present
The saga of the U.S. rig count is nothing short of a riveting rollercoaster, filled with dramatic ascents and heart-stopping plummets. Picture December 1981: more than 4,530 rigs busily churn like ants at a summer picnic. Fast-forward to August 2020, with only 244 rigs—like a party where everyone’s gone home. Since 1940, Baker Hughes has charted these dizzying trends, revealing peaks and troughs that echo industry shifts. Horizontal rigs, those crafty innovators, stole the show during the 2012-2014 shale boom, before crashing in 2016. By 2019, they rallied again, embodying an impressive phoenix from the ashes narrative. Horizontal drilling, due to higher production efficiency, has considerably outpaced vertical drilling in its recovery, with over 400 rigs by the first half of 2024. Quite the story! With the current rig count at 544, U.S. drillers have continued to build upon this rich history, signaling resilience and adaptability in the midst of global demand shifts. As the industry evolves, growing attention is being paid to reducing carbon emissions across energy sectors, prompting drillers to consider cleaner operational practices alongside traditional production goals.
How Rig Trends Affect Global LNG and Energy Prices?
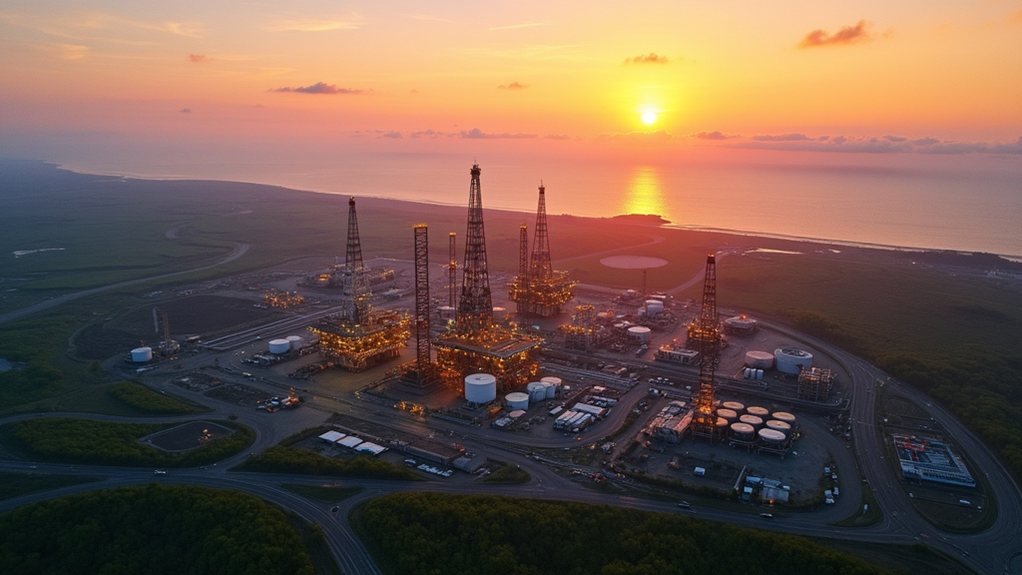
In the ever-evolving landscape of oil and gas, the rig count story is turning its gaze towards the dynamic interplay between these trends and global energy prices. A declining U.S. rig count contradicts expectations, as production efficiency skyrockets. Imagine fewer cooks in the kitchen creating a record feast! Despite fewer rigs, crude and natural gas production hit new highs, fueled by technological advances and strategic plays. The result? Stability in energy prices buffered by these operational marvels. The U.S. crude oil production remained substantial, averaging 13.585 million bpd, showing resilience amid fewer rigs. The U.S. is recognized as the world’s largest LNG exporter, with capacity projected to rise to over 21.5 bcfd by 2030, supported by substantial infrastructure investments. However, if this balance wavers, price volatility could strike like an unpredictable lightning bolt. The environmental impact of expanded LNG operations is increasingly scrutinized, as emissions from extraction and transport span three distinct categories that regulators and companies alike must account for. In drilling, it seems less can indeed be more.